Top 11 U.S. Financial Services Advertisers and their Online Spend

image The annual U.S advertising spend-report just arrived from Advertising Age. As usual, financial brands were big spenders. Eleven financial brands were in the top 100, including two in the top 10 (JP Morgan Chase and American Express).

Internet spend (note 1): Experian was the #1 spender online among all companies in all industries with a reported $350 million. That amounts to more than 3% of the entire $10 billion spent online in the United States last year across all industries. The credit-reporting giant didn’t spend enough offline to crack the top 100 in total advertising, which means at least 80% of its total spending is online.  

Among the big overall spenders, estimated Internet spending varies widely. American Express, BofA, Capital One, and State Farm all spent a bit more than $100 million.

In terms of percentage of all advertising, the totals varied widely. On the low end, JP Morgan, Discover and Visa devoted 2% to 3% of their budget to online advertising. On the other side, Capital One, Citi, and Progressive all placed around the 9% mark.   

————————

Table: U.S. advertising spending
Total of measured media and estimated unmeasured*

Company** 2012 2011 %Chg Internet % Internet Top-100 Rank
1. JP Morgan $2.1 bil $2.4 bil (11%) $46 mil 2.1% 8
2. AmEx $2.1 bil $2.1 bil (3%) $120 mil 5.7% 9
3. BofA $1.6 bil $1.7 bil (5%) $110 mil 6.9% 18
4. Capital One $1.3 bil $1.0 bil +22% $110 mil 8.5% 26
5. Citi $930 mil $980 mil (5%) $81 mil 8.7% 41
6. Progressive $800 mil $800 mil $77 mil 9.6% 51
7. Allstate $790 mil $740 mil +8% $52 mil 6.6% 54
8. State Farm $780 mil $800 mil (3%) $110 mil 14% 55
9. Discover $600 mil $460 mil +30% $12 mil 2.0% 68
10. Wells Fargo $580 mil $610 mil (5%) $21 mil 3.6% 70
11. Visa $480 mil $490 mil (1%) $12 mil 2.5% 83
Total $12.1 bil $12.1 bil $750 mil 6.2%
Experian INA INA INA $350 mil 80%+ NA

*Source: Advertising Age, 24 June 2013; methodology; The % change number was calculated with more precise annual spend numbers than what appears above
**We did not include Warren Buffet’s conglomerate Berkshire Hathaway which owns Geico and had the following numbers: 2012 = $1.6 bil; 2011 = $1.4 bil; +13%; Internet $31 mil, 1.9% of total

————–

Note:
1. Internet spend covers desktop display/search only. Does not include mobile or video ad units. 

Op Ed: MRI Study Finds Consumer Interest in Fee-Based Bundles

by Dr. Dan Geller

Dr. Geller is EVP of Market Rates Insight, which provides competitive research and analytics to financial institutions. He can be reached at dan.geller@marketratesinsight.com.

——————————-

imageOne of the most significant findings from our  latest study on banking fee-revenue optimization (see note 1 below) is that the majority of consumers say they will pay monthly subscription fees for value-added financial services (see chart below and list right).

The average monthly fee that more than half (55%) of consumers are willing to pay ranges from $2.17 to $5.06 per month for each service. Of course, these stated amounts are an indication of relative perceived value rather than a pricing guide.

Furthermore, we found that consumers are willing to pay a higher overall monthly fee for the bundle than they would for each of the services individually. For example, study respondents indicated they are willing to pay $3.07 per month for a credit score report, $2.43 for account alerts and $4.27 for prepaid card for a total of $9.77. However, when the three were offered as a bundle, respondents valued them at $10.51, an 8% premium.

Bottom line: We believe there is a path for financial institutions to move customers "from free to fee" by bundling services in the optimal way.  

—————————-

Chart: Consumer Interest in Value-Added Banking Services

image 
Source: Market Rates Insight, June 2013

——————————

Note:
1. For more info on these finding, MRI is offering a free webinar on Tuesday June 18 from 2:00 PM to 3:00 PM Eastern Time. Click here to reserve your space. The full report will be available for purchase beginning June 21 at <marketratesinsight.com>.

Metrics: Mobile Banking, Payments, Insurance and Investment Usage

imagecomScore is compiling a wealth of digital usage data, both for desktop and mobile (see previous post). And luckily, they have agreed to let me share some of it here (see note 1).

The following chart is financial services usage data across 230 million U.S. mobile phone users aged 18 or older (note 2) in the United States as of year-end 2012. It includes any type of financial content, secure or public (i.e. this is not limited to secure access by account holders).

The data shows that 62 million (27%) of mobile users accessed financial content during the prior month (Dec. 2012 figures). The vast majority of those (87%) accessed bank content. Credit card or electronic payments (e.g. PayPal) were each used by about half the segment. And brokerage or insurance content was accessed by about 20% of mobile financial users.

Observation: The banking numbers have been widely circulated, but I hadn’t seen recent breakouts in insurance and brokerage. Both were surprisingly high, especially insurance. If you assume there is generally one mobile financial user per household, that means that about 10% of all U.S. households are using mobile insurance info. Same on the brokerage side.

image
Source: comScore, compiled Dec. 2012

————————————

Notes:
1. If you have requests, drop me a line and I’ll see what I can find.  
2. Users of any type of mobile phone, smartphone or otherwise. Also includes text-message queries.

Metrics: Mobile Traffic at the 10 Largest U.S. Banks

imagecomScore just enhanced its website traffic reporting by showing both the mobile and desktop  audience at major websites. They call it Media Metrix Multi-Platform. The top-50 U.S. sites are available here.

Unfortunately, there are no banks in the top-50 and just one fintech company (Intuit, note 1). But comScore forwarded us a list of the top-10 banks to share with readers (thanks, see table below).

Highlights:

  • The mobile-only group is becoming a significant segment, amounting to about 20% of the desktop banking group (across all banks)
  • However, BofA and Chase have much higher mobile-only groups, 50% higher than any other top-10 bank
  • Across all banks, 40% of mobile users are “mobile-only” while 60% also use desktop online banking
  • But at BofA and Chase, about 2/3 of their mobile base is “mobile-only”

Bottom line: It is no surprise that mobile usage is significant. But what I didn’t realize is how quickly mobile users are giving up desktop online banking. Look at Chase and BofA, which have had mobile the longest. Only 1/3 of their mobile users went to the desktop during February. Partly, that’s because many are single-service credit card customers. But it’s strong evidence for what many have hypothesized: once users become accustomed to mobile convenience, they have much less need for desktop access.

——————————-

Table: U.S. desktop and mobile traffic at the top-10 busiest U.S. banks
millions of unique visitors, age 18+ (Feb 2013)

Feb 2013 (USA) Total Desktop Mobile* Mobile Only Mobile Incremental**
Total U.S. Internet 236 221 127 14.5 7%
Banking total 102 85.1 39.1 16.4 19%
1. Bank of America 31.5 24.1 11.7 7.4 31%
2. JPMorgan Chase 28.3 21.9 9.9 6.3 29%
3. Wells Fargo 22.2 20.0 3.5 2.2 11%
4. Capital One 15.4 12.7 3.8 2.8 22%
5. Amex 15.3 12.6 3.8 2.7 21%
6. Citi 11.8 10.4 2.0 1.4 13%
7. Discover 7.8 6.5 1.7 1.3 20%
8. HSBC 6.5 5.5 1.3 1.0 19%
9. US Bank 5.5 4.8 0.9 0.7 14%
10. PNC 4.8 3.9 1.1 0.8 21%

Source: comScore, March 2013 (methodology)
*Includes smartphone and tablets, native apps and mobile Internet
**Mobile-only divided by desktop base

———————————————–

Notes:
1. Intuit placed #42 of all U.S. digital properties with mobile audience of 15 mil, desktop of 29 mil, and total 38 million. It had 8.9 million mobile-only users, 31% of its desktop base.

Mobile Banking & Payments by the Numbers

Statement rewards provider and BillShrink parent, Truaxis, published a nice summary of mobile banking and payments on its blog (reprinted with permission below).

A few Industry Players metrics at the bottom of the infographic have recently been updated:

  • Starbucks said this week it has processed 42 million mobile payments, up from 26 million (Venture Beat, 9 April 2012)
  • Square has now shipped 1 million readers, up from 500,000; and is now processing $11 million per day, up from $4 mil (Splatf, 5 March 2012)

Mobile banking & payment infographic

New Online Banking Report Published: Online & Mobile Forecast Through 2021

image
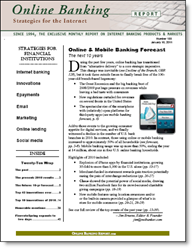
The latest research is now available: Online Banking Report: 2012 to 2021 Online & Mobile Banking Forecast. The report includes our latest 10-year online banking, mobile banking and bill-pay forecast for the U.S. market. Online banking remains relatively flat, growing less than 5%, while mobile expanded by more than 40% last year (see note 1).

We still believe mobile is on a path to surpass online banking in the United Sates by the end of the decade (note 2). Although by then, the two will be very similar, if not identical.

The report also includes a revised 10-year forecast for U.S. peer-to-peer lending. After growing five-fold in two years (2011 vs. 2009), we expect continued strong growth of nearly 40% compounded annually through 2021.

Finally, we took one last look at 2011 and documented the top ten innovations or trends of the year (see below). We also updated our top-10 project priorities for 2012.

__________________________________________________________________

Top innovations & trends of 2011
__________________________________________________________

The report includes a summary of the top ten innovations or trends during the past year (in alphabetic order):

  • Ad-supported banking gains a foothold
  • BillGuard launches transaction-monitoring tool (screenshot below)
  • Capital One acquires ING Direct USA
  • Mobile banking goes Android
  • P2P lending doubles 
  • PFM turns its attention to debt management
  • Square re-engineers off-line POS
  • Social media-fueled banking backlash
  • Truly virtual banks arrive
  • Youth banking gets a powerful new entrant

__________________________________________________________________

New entrants to the OBR Hall of Fame 
__________________________________________________________________

Each year we rank the top online/mobile innovations of all time (North America). There are a total of 46 achievements listed from 45 unique companies:

  • 15 banks
  • 5 credit unions
  • 10 non-bank financial services companies
  • 15 technology companies

The class of 2011 included three new entrants:

  • BillGuard for creating a PFM application (transaction scanning) that provides tangible value to the mass market
  • Doxo launches first full-featured virtual billing file cabinet 
  • Mint for putting all the pieces together to create a compelling online personal financial management system (note 3)
  • Personal Capital, for doing for wealth management what Mint.com did for retail customers

__________________________________________________________________

About the report 
__________________________________________________________________

Online & Mobile Banking Forecast (link
The next 10 years: 2012 through 2021

Author: Jim Bruene, Editor & Founder

Published: 6 Jan 2012

Length: 40 pages, 27 tables, 14,000 words

Cost: No extra charge to OBR subscribers, US$495 for others here

————————-

BillGuard is one of four new companies added to the OBR Hall of Fame in 2011 (9 Jan 2012)
Note: Powerful homepage message: Protect Your Money


BillGuard's homepage has a powerful call to action

———–

Notes
1. The penetration of online banking into U.S. households is relatively flat going forward. However, because each household accesses a larger number of financial accounts, growth at individual financial institutions is still growing on average. 
2. Forecast is for the United States. Mobile has already surpassed all types of banking in some developing countries. 
3. Mint.com is being added four years past its 2007 launch. Since it didn’t pioneer any specific new features, we hadn’t put it on the list. But, we’ve decided its legacy of improving the user interface for online banking is worthy of making it into the OBR hall of fame.

Lifehacker, Bank Technology News Spread the BankSimple Meme

imageBankSimple has already become well known among the digerati and its notoriety is spreading to the mainstream press (here and here). Bank Simple’s latest PR coup was being named Tuesday to the Bank Technology News annual top-20 innovators list (see note 1).

Quite a feat for a company that hasn’t yet launched or even shown its service outside a small group of testers (note 2).

Lifehacker Asks, “Are you happy with your bank?”
Lifehacker, a popular blog (note 3) that deals with personal productivity and other minutiae of day-to-day living, positioned the BankSimple story as a backlash against traditional banks in a post titled, “Are You Happy with Your Bank?”

imageAfter a few speculative paragraphs about Bank Simple, the blog concluded with a quick poll to see how motivated its readers were to switch banks. I expected this self-selected sample to be very anti-bank. But surprisingly, more than half the 3900 voters declared themselves relatively satisfied with their bank. Only 13% said they were unhappy and another 30% said they’d consider consider switching.

Given the sample bias, you can’t read too much into the the data. But it does demonstrate that even in a worst-case polling situation — where participants are pre-conditioned with a vision of a utopian entity that does everything right with nary a fee — it’s still difficult to budge consumers away from their existing bank/credit union.

Notes:
1. Four recent Finovate alums were also listed: Backbase, CashEdge, Intuit, and Segmint (see our Finovate blog post yesterday).
2. If you read all the published articles, a fairly thorough picture of Bank Simple emerges. It will not be a bank, but a simple web 2.0 interface (e.g., Twitter/Tumblr) on top of a checking account (e.g., what PayPal did for online payments ten years ago).
3. According to Compete, Lifehacker averages about 1.2 to 1.5 million unique U.S. visitors each month.

Trusteer Quantifies the Biggest Online Banking Security Weakness: The End User

image I’ve often wondered how many people use the same username/passwords at their bank as they do at other random websites. I figured it was a substantial number, but never expected it to be as high as the 73% Trusteer cited in a recent white paper (note 1). That’s why most financial institutions have used “multi-factor authentication” for years.

One of the most common multi-factor techniques is to ask additional questions if the bank detects a login from an unknown computer. However, it’s possible that these same people are also using the same “secret question” answers at non-secure websites, defeating this multi-factor approach.   

Luckily, it’s still relatively difficult to remove money from most U.S. consumer accounts because online interbank transfers are more tightly controlled, or simply not offered. However, if crooks are able to log in to online/mobile banking and determine the user’s account numbers (debit, credit, or checking), a number of more lucrative frauds can be engineered.

What’s a bank to do:

  • Use secret questions that are not commonly used across the Web. Or allow users to create their own, but caution them not to use ones they see at other non-banking websites.
  • Create an additional out-of-band authentication process (e.g., text message an approval code) for moving funds out of an account.
  • Do not allow online banking users to see their own account numbers online
    (note 3)
  • Educate/encourage customers to use different username/password for online banking than for other non-financial sites
  • Financial institutions using Trusteer’s Rapport service can identify which customers are sharing username/passwords at less-secure sites and ratchet up internal fraud control settings for these customers

And the most effective method, which we don’t recommend because it’s just too painful for the user experience:

  • Force users to make more challenging usernames and/or password such as those with a capital letter, number and/or special character

Silicon Valley Bank (SVB) offers Trusteer’s Rapport (link, 2 Feb. 2010)

image

Notes:
1. While 73% shared banking passwords with other sites, less than half the total, 47%, shared BOTH username and password. Two other data points:
– 65% of user-selected banking usernames were used elsewhere
– 42% of bank-selected banking usernames were used elsewhere
2. Trusteer’s data was compiled over 12 months using its plugin software running on more than 4 million computers (see previous post).
3. There’s still the issue of the easy-to-read account number on check images; it would be nice to mask it, but that’s probably not worth the expense) 
4. For more info on Trusteer and other security topics, see our previous reports such as, Online Banking Report: New Security Techniques (Sep. 2008)

The Best of BAI Retail Delivery 2009

imageLast week, I attended the BAI Retail Delivery conference in Boston (for more background on the event, see note 1). I enjoyed the show tremendously.

What’s not to like? Famous speakers, new products, several thousand attendees, statistics galore, and a floor filled with new bank tech. For me, the only disappointments were the non-industry keynoters, who are not why I attend, but are something to tell your friends and family about when you get home (note 2).

Like last year, I’ll cut to the chase and hand out my personal awards for the event. I saw only a tiny fraction of the companies, so the list below shows merely my favorites culled from about two dozen company interviews. 

The Netbanker awards

  • Biggest buzz: Person-to-person payments (we’ll cover it in Online Banking Report soon
    Runner up: Mobile banking and payments
  • Most likely to make the cover of FastCompany: Cardlytics (will cover next week)
  • New solution most likely to be used by 1000 financial institutions: Continuity Engine’s semi-automated, compliance task-management service
    Least likely: Microsoft Surface, as cool as it looks, I just don’t see banks deploying it in large numbers
  • Most audacious business plan: Monetawinner of this very award last year, but did indeed appear in Boston with a major client win, SunTrust (see Celent’s Jacob Jegher’s not-at-all enthusiastic post on the announcement)
  • Best ah-ha moment: When Joe Salesky, Clairmail founder, observed that mobile banking is a 100% solution, meaning it’s for every customer NOT just the half that do online banking
  • Biggest surprise: The buzz around person-to-person payments and relative lack of buzz around online PFM
  • Most-talked-about vendor without a booth: PayPal which announced partnerships with three large bank tech companies: S1, FIS, and First Data’s STAR unit
  • Coolest online feature, not yet available: Credit card available-balance meter displayed directly on the user’s PC desktop, powered by Worklight
  • Coolest new GUI feature: Fiserv’s ebill snapshots
  • Best demo (I’d not seen before): Dynamic Card Solution’s instant issue of a credit card with my picture on it along with a background image I chose from hundreds available
  • Best-attended breakout session (that I attended): Checking 2.0 which analyzed what the product might look like if NSF/OD fee revenues are materially limited
  • Best number: From the opening remarks by BAI director, Debbie Bianucci: According to BAI research five years ago, one-third of consumers preferred to deal with their bank remotely; now, two-thirds do
    Runner up: Bank of America’s Doug Brown revealed in his presentation that BofA has 3.5 million active mobile banking users (see recent monthly growth below)image
  • Scariest number: A prediction from Sherief Meleis (Novantas) that new regulation could wipe out 20% to 40% of total checking account revenue
  • Missing in action: Security solutions
  • Coolest new event technology: Real-time text voting in the Checking 2.0 session
    Runner up: Wifi available conference-wide for the first time ever
  • Most intriguing co-brand opportunity: Getting the bank logo on PayPal messaging (FIS, S1) to payment recipients or during payment sessions (FirstData STAR)
  • Product I most wanted to use now: Digital Insight’s (Intuit) FinanceWorks with Turbotax integration
  • Best screenshot: Lamping on the iPhone (powered by ClairMail); I call it the “little red number” superimposed over iPhone icons, that tells you how many messages are available (see inset)
    Runner up: Worklight’s visualization of its widget running in four environments with essentially the same GUI (see below)
  • Best party: Geezeo’s blowout at Lucky’s
  • Best freebie on the floor: Fresh lemonade from the wonderful people with a booth by the front entrance
  • Netbanker spotting: Quote in BofA’s Doug Brown’s Powerpoint regarding BofA threepeat (in the mobile marketplaces)

And I’m always collecting usage stats and other numerical detritus delivered during the presentations. Here are my notes with (source in parenthesis):

  • 27% of U.S. households are now mobile only (Doug Brown, BofA)
  • New mobile customers at BofA last 3 months: 150,000 (Sep); 210,000 (Aug); 220,000 (July) (Doug Brown, BofA)
  • In U.S. and worldwide, text message volume has surpassed voice call volume (Doug Brown, BofA)
  • 99% of mobile users view balances, 90% view transaction detail, about $10 billion of funds have been moved via mobile transfers/bill pay; 15 million location-based searches being performed (annual run rate)
  • BofA has 35% of all mobile banking users (Doug Brown, citing ComScore numbers in 2009)
  • BofA has added 150,000 new checking accounts due to mobile offering
  • BofA seeing voice calls decline among mobile users, but online banking usage holding steady
  • In pilot, 94% of the users of TurboTax within FinanceWorks chose their host banks to deposit tax refunds (Digital Insight/Intuit)
  • More than 50% of iPhone users have used mobile banking in past 30 days (Javelin Strategy)
  • 33% of mobile banking users monitor accounts daily, 80% wee
    kly (Javelin)
  • Customer willingness to pay fees for (Novantas):
    — Teller transactions 8%
    — Bill pay 12%
    — Mobile banking 12%
    — Paper statement 19%
    — ID protection 27% 
  • At ANZ, 65% of its Yodlee-powered PFM (launched Oct 2008) users visit daily; 89% visit weekly (Doug Brown, ANZ; not a typo, there really were two Doug Browns)
  • 81% of its PFM users rated the service at least 7 points on 10-point scale (31% rated 9 or 10; 50% rated 7 or 8)
  • ANZ’s PFM is a standalone free service that can be used by anyone; so far, 20% are non-ANZ customers; the business case for the service was built on customer acquisition, but they also may charge certain users for certain functions
  • Yodlee-powered PFM users spend twice as much time online at the bank than regular users, and only 1.5% leave the bank each year compared to 7% of regular online banking customers 
  • Worklight case study results:
    — 8% to 15% of online customers install widgets within the first year
    — 95% of widget users are active
    — Customers conducted 15 to 30 sessions/month via widgets

Worklight widgets running on a variety of platforms (4 Nov 2009)

image

Notes:
1. About BAI Retail Delivery Conference 2009

BAI Retail Delivery is an annual rite of passage for bank tech strategies, delivery system analysts, and product managers. At the peak, in 1999/2000, there were as many as 10,000 people there (attendees + exhibitors) and close to 500 exhibitors stretching perhaps three or four city blocks in each direction through cavernous exhibit halls. It was a little like Times Square but without the highrises. Some exhibitors had massive 10,000 square foot booths filled with hardware. And the show-floor routinely sold out.

Financial institutions brought teams of people to pour over the new machines and software solutions, be inspired at the general sessions where Bill Gates, Roll Perot, Scott Cook, and other tech-industry luminaries showed up to win over the bankers.

Fast-forward a decade. It’s still an awesome event which I highly recommend. I thoroughly enjoyed every conversation I had and most every session I attended. But the event has downsized considerably. This year, you could walk across the exhibit hall in a few minutes. And if you wanted to, you could have spent five minutes with all 180 companies during the show hours. That would have been impossible last year with around 300 exhibitors. But all-in-all, I’d say there was more energy on the floor this year because the attendee per square foot ratio seemed much better.

2. Unfortunately, on Thursday both Al Gore (planned) and Jack Welch (unplanned back problems) phoned in their keynote addresses via sat-link.

Numbers: Remote Deposit Penetration at Randolph-Brooks FCU

image In an article in today’s Austin Business Journal about the coming launch of mShift-powered mobile remote deposit at Randolph-Brooks Federal Credit Union, the CU revealed its penetration number in its EasCorp-powered, home-scanner-based service, eDeposits:

Total members: 300,000
Total checking account customers: 202,000
% of checking using remote deposit: 5%
Number of remote deposit users: 10,000 (derived)
% of members using remote deposit: 3+% (derived)

The San Antonio, TX-based credit union expects more mobile users than in-home users. The product, which debuted at Finovate on Sep. 29, is currently being tested with employees before it rolls out to select customers.

imageUSAA was the first major financial institution to launch mobile remote deposits in August.  But WV United beat them to market in July earning our OBR Best in the Web award. And this week, speaking at BAI Retail Delivery, Bank of America’s Doug Brown was bullish on the feature, leading many to believe that the giant would add the feature to its mobile offering at some point (see note). And if that happens, it’s not inconceivable the feature could show up in television commercials, either from BofA or Apple.

Note:
1. In response to an audience question after his presentation, Brown said that the bank was seeing 1 million envelope-free deposits made at ATMs every day, and “there was an obvious use-case in mobile”. Note that he did not specifically say, or even directly imply, that BofA would launch it, but he also didn’t dismiss the idea. 

NetBanker 2009 Survey — Please Give Us Your Feedback

Feedback is important for improvement and reaching one’s maximum potential. That fact is why businesses have regular reviews for top employees, the best athletes have coaches and elite schools have grades. In order to be their best, people and businesses need to regularly receive criticism, suggestions, advice and ideas from others. We at NetBanker are no different.

So we’d love for you to take 5 (or less) short minutes to fill out our annual reader survey (it’s completely anonymous). This is your chance to tell us a little about yourself, what matters to you, how we can do better and more. Please help us serve you better by clicking the link below and filling it out right now:

http://www.netbanker.com/2009readersurvey.htm

If you’d rather give your feedback in a more personal way than this survey, please feel free to contact me at eric@netbanker.com. Thanks!


ericphoto.jpgEric Mattson is CEO of Online Financial Innovations, the parent company of NetBanker, Online Banking Report and the Finovate Conference Series. He can be reached at eric@netbanker.com or 206-331-1178.

Online Banking Customer Satisfaction Remains High

Three substantial consumer studies were released this week. In total, more than 12,000 U.S. consumers weighed in on their banking satisfaction. All three projects came to the same and somewhat surprising conclusion:

Consumer satisfaction with banks and/or online banking has remained high, and relatively unchanged, despite the events of the past year.

I expected all the bad press, not to mention a couple trillion in bad loans, would drag down scores across the board. But apparently consumers are loyal to their primary financial institutions, or feel sorry for them, and continue to hand out high grades when market researchers come calling. That’s a bit of good news for the future of the industry.

image1.  Forrester’s The Experiences that Satisfy Consumers 2009 (post here) has an interesting comparison across industries and across channels (phone, in-person, and Web) and Web banking was the star of the study (note 2):

  • Banks had the highest satisfaction of all eleven industry categories (note 3) in the Web channel (84%). The low was 66% at health insurers and TV service providers.
  • Banks had the highest satisfaction differential between their online and telephone channels, with Web beating phone by 12 points (84% vs. 72%). The next highest was PC manufacturers with a 9-point differential, followed by Internet service providers at +8 points.
  • And surprisingly, given how much money is spent on branches, banks had the second-highest satisfaction differential between online and in-person, +5 points (84% vs. 79%). First place was airlines, with a 9-point differential. Third place went to wireless providers at +2 points. 
  • Banking was only industry to increase its Web satisfaction rate compared to a year ago
  • Only 2 channel scores beat banking’s Web satisfaction and both of those were in-person experiences: retailers (88%) and hotels (86%)

image 2. comScore’s annual state of the online banking industry (note 4, press release) found that overall customer satisfaction is relatively unchanged during past three years:

  • Percent of total customers who were “highly satisfied” of their primary financial institution
    2007 = 70%             2008 = 72%           2009 = 71%

image 3. ForeSee Result’s annual state of online banking (note 5, press release) found considerable growth in online banking satisfaction during the past 5 years:

  • Out of 100 points, here’s the scores for online banking:
    2003 = 73    2005 = 77   2007 = 78   2008 = 82   2009 = 83
  • Credit unions had the highest satisfaction in the 2009 survey
    Credit unions = 86    Community banks = 82  Large banks = 82

Notes:
1. Forrester: Number = 4,500, fielded Q4, 2008; purchase here for US$749
2. Forrester broke out credit card issuers separately, but their Web and phone satisfaction rates were identical, so I’ve lumped them together to simplify the analysis.
3. The other categories: Airlines, health insurance plans, hotels, insurance providers, Internet service providers, investment firms, PC manufacturers, retailers, TV service providers, wireless service providers.
4. comScore: Number = 4,846, fielded last week of Feb. 2009
5. ForeSee Results: Number = 2,500, fielded March 3-18, 2009