Types of Small Business
Small business means different things to different people. For the
sake of simplicity, in this report we’ll usually use the term “small
businesses” to refer to the following segments:
Two major classifications used in this report:
1. Microbusiness: Basic financial needs, such as Quicken
support, simple invoicing,
credit card processing, bill payment, home equity credit lines, and tax
reporting; usually sole proprietorships, partnerships, or S-corps (includes
self-employed); often with less than 20 employees; total revenue of $50,000
to $1 million annually; total credit lines of less than $250,000.
2. Small Business: More complex financial needs, such as
accounting support, invoicing, payment processing, bill payment, commercial
credit lines, tax reporting, and internal security and fraud controls; less
than 500 employees; total revenue of $1 to 10 million annually; total credit
lines more than $250,000.
Other business types included in above classifications:
· In-formation Business: Initially, may be more interested in
advice and information on credit, payment processing, and other banking
services; depending on many factors, may move rapidly towards launch and
need to quickly establish accounts and line up financing. Financial needs
vary depending on the business plan and funding.
· SOHO (small office, home office): Smaller, work-from-home
sole proprietorships. It can also be used to describe mobile workers such as
home-based salespeople in insurance and manufacturing. We classify these
companies as microbusinesses.
· Self–employed: Persons who primarily work for
themselves, either as contractors, consultants, or commission-based sales
reps. We classify these individuals as microbusinesses.
· SMB/SME (small and medium business/enterprise): Usually
refers to the largest segment of “small” businesses, companies with at least
several million in annual revenues. We classify these companies as small
businesses.
Primary Data Source
The primary data source for this report is TNS Financial Services
Group (formerly NFO WorldGroup-Financial Services, and before that,
PSI Global). Our thanks to EVP Maria Erickson and her staff for
answering our questions and making data from their Small Business and
SOHO studies available. For more information on purchasing financial
services research contact Ms. Erickson at (813) 227-8562.
The Small Business and the Affluent Entrepreneur 2003 Study
was fielded between April and May 2003; the owners of 3000 U. S.-based
small businesses with annual sales between $500,000 and
$10 million were contacted by telephone or mail to provide the most
accurate and reliable
information possible.
Using the same methodology, 900 small businesses were contacted for
the SOHO and the Entrepreneur Study 2002 between September and
October 2002.
The big picture in small business
Small businesses exist in all markets, in every town and at
every crossing. Using a broad definition that includes smaller part-time
business endeavors, there are more than 20 million businesses in the United
States, one of every five households. And that understates the market
potential. If you also include the personal product usage of the
“business-owning” segment, the total could be as much as 50% of your
revenues.
Depending on the definition, as many as 30 million business
entities exist in the United States, including self-employed or part-time
sideline businesses such as selling collectibles on eBay, or as few as 1.2
million if you only look at companies with at least $1 million in annual
revenues
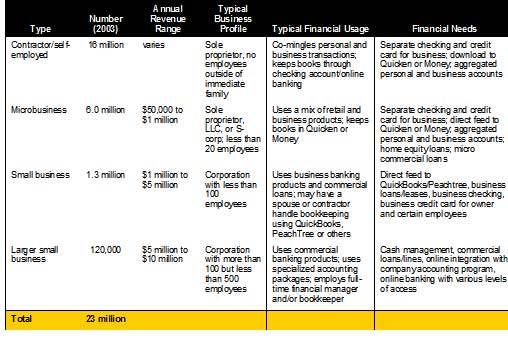
. For the purposes of this report, we are defining the total small business
market as 23 million, a figure taken from U.S. Small Business Administration
statistics1.
The total includes
· 16 million self-employed/contractors
· 6.0 million microbusinesses with revenues less
than $1 million
· 1.3 million of that is the larger small business
with revenues of $1 to $10 million
Small businesses account for:
· 99% of all employers
· 51% of private sector employment
· 67% of net new jobs
· 52% of U.S. gross domestic product
Furthermore:
· 600,000 new businesses are started each year1
· 13% of U.S. households own privately held
businesses2
· Business-owning households had higher income, more
education, significantly higher net worth, and were led by individuals in
the prime age group 35-602
· Boeing Employees Credit Union’s recent
survey showed that 50,000 of its 350,000 (14%) members reported owning
businesses or being key decision-makers in one3
· IDC reports there are now 15 million U.S.
home-based businesses, 10 million full-time and
5 million part-time4
· More than 400,000 people make most or all of their
living from selling on eBay5
(1) SBA Research Summary #211, “Small Business Share
of Economic Growth,” Jan. 2002
(2) George W. Haynes, Assistant Professor at Montana
State, and Charles Ou, SBA Economist, presented an Advocacy Working Paper at
the Conference of Entrepreneurial and Financial Research in April 2002
(3) American Banker, 4/13/04
(4) 2004 estimates from IDC as cited in The Wall
Street Journal, 6/17/2004
(5) Estimate from AuctionDrop, a company that earns
commissions selling merchandise on consignment through Ebay, as cited in
The Wall Street Journal, 6/17/2004
Who wants to be a microbusiness?
|
Table 3 Number of U.S. Home-based Businesses
Source: IDC, as cited in The Wall Street Journal, 6/17/04 |
||||||||||||||||||||||||
Everyone it seems. While American attitudes towards big business have
declined markedly during the past four years thanks scandals at Enron,
MCI, and others, the small business remains on a pedestal. Its
human nature to root for the underdog, and the smaller the business the
bigger their perceived disadvantage.
As you plan your business offerings, keep in mind that a majority of
Americans aspire to run their own business; fully two-thirds (67%) profess a
longing to be in business for themselves. And thanks to computers and the
Internet, there are 15 million home-based businesses in the U.S., 400,000 of
which make their living from selling on eBay. Surprisingly, though, the
number of part-time, home-based businesses has fallen dramatically in the
past five years, probably victims of the flat economy
(see Table 3, above).
Since most tax experts recommend separate personal and business
transaction accounts for even the smallest business, companion
personal/business checking, savings, and card products can be a lucrative
niche for financial institutions. Once you’ve convinced retail households
running businesses from home to add a business transaction account, you can
cross-sell credit and accounting services as the businesses grow.
Channel Preferences
|
Table 4 Primary Banking Channel Among Businesses
Source: Gartner G2, 2002 |
When it comes to financial matters, small businesses want it all, every
channel, all the time, at the lowest cost. Even among online business
banking users, only one-third say that the online channel is primary
(see Table 4, right). Although businesses may want it all,
they often do not have the resources or inclination to shop aggressively for
the lowest-cost source. The smaller the business, the likelier it is the
principal or a spouse handles banking matters. And these owners are unlikely
to make it a priority to wring every last dollar out of the cost of their
financial services. The story is quite different if the business has a
dedicated bookkeeper or financial manager on staff. This person may have
both the time and motivation to comparison shop; it’s a feather in their cap
if they find cost savings. So you may want to segment your business
customers, not
on total revenues, but on whether the owner handles the banking. And shower
special
attention on staffers hired to handle the
business’s financial affairs.
Table 5
Number of U.S. Small Businesses by Annual Revenues

Source: TNS Financial Services Group, Small Business data 4/03, SOHO/Entrepreneur
data 10/02, updated to year-end 2003 by Online Banking Report, +/- 20%
Table 6
U.S. Businesses Entities by Annual Revenues
not including self-employed/contractors
Source: TNS Financial Small Business Market Study 2002, 4/03
(commercial banking numbers from 4/00); updated to year-end 2003 by Online
Banking Report, =/- 20%
1The person at the company that handles the majority of
banking activities
2Could be serviced by commercial banking department depending
on circumstances
Table 7
U.S. Small, Micro, and Self-Employed Businesses Using Online
Banking and/or Bill Pay
millions, n = 23 million (2003)

Source: Online Banking Report estimates 6/04; accuracy estimated at plus or
minus 30% U.S.
All = All small businesses including self-employed, n = 23 million (2002)
Larger = Small and microbusinesses with annual revenues between $50,000 and
$10 million, not including self-employed and contractors, n = 7.3 million
(2003)
Table 8
Annual Growth Rate of Small, Micro and Self-Employed Businesses
Using Online Banking
millions of net new U.S. small business online banking users and
percent change from previous year
&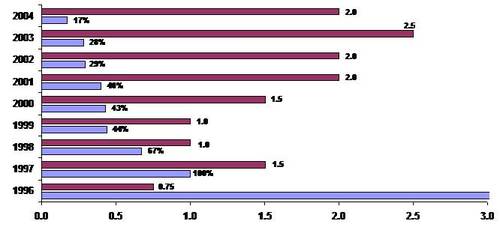
Source: Online Banking Report estimates, 6/04; accuracy estimated at plus or
minus 30%