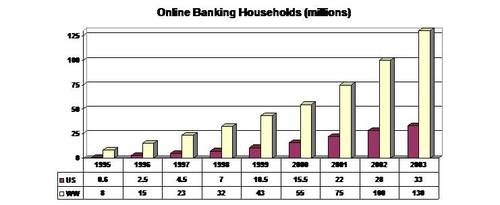
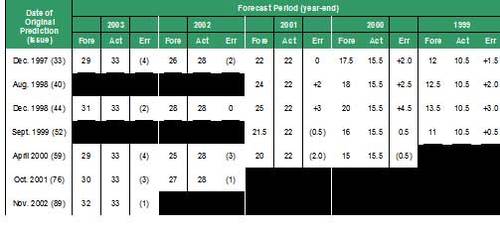
Last year, we predicted there would be 32 million U.S. households banking
online by year-end 2003. Actual results appear to
be slightly higher, with an estimated 33 million households as of Dec. 31.*
The payments area continued to be a major factor in the household growth,
as direct bill-pay at billers’ websites increased 20-fold, from 1 million
users at the beginning of 2001 to 20 million at year-end 2003.
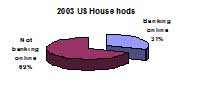
Not only is online banking penetration growing, but the level
of usage is also increasing. Power Users, households that access bank
accounts AND pay bills, have grown five-fold in the past three years; from
3.5 million to 23 million. Less than half use their bank’s pay-anyone
bill-pay service, electing instead to go directly to the biller’s site to
settle the bill.
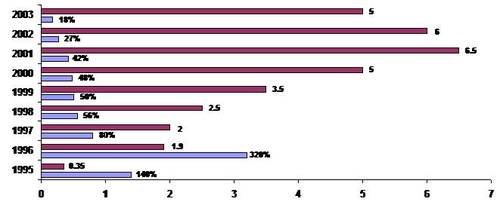
For 2004, we project an overall growth of 4 million new online
banking/bill-pay households (range: 2 to 5 million), about 20% fewer
newcomers compared to the 5 million added in 2003. Also, the rate of growth
will slow to 12% from 2003’s 18% (range: 7% to 14%). Online banking
penetration is projected to grow to 34% of U.S. households, compared to 31%
today.
*More precisely, the year-end total is somewhere in between 29 and 36
million households based on our estimated accuracy of minus 12% and plus
10%.
Table 7
Online Banking Forecast Summary
U.S. households using online banking and/or
epayments*

Source: Online Banking Report projections based on industry data (+/-
20%)
Table 8
Consumer Online Banking1 and Bill Payment Forecast
millions of U.S. households using online banking and/or bill
payment each month

Source: Online Banking Report, 12/03 HHs = households n/o
= not offered
Accuracy estimates: US: 1994 to 2003: +/- 12%; 2004 to 2006: +/- 15%; 2007
to 2009: +/- 20%; 2010 to 2013: +/- 25%; WW: +/- 35%
Table 9
Small Business Online Banking13 Forecast
millions of U.S. small businesses using online banking
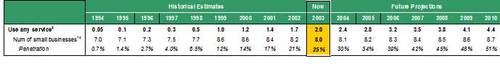
Source: Online Banking Report, 12/03
Accuracy estimates: 1994 to 2003: +/- 25%; 2004 to 2013: +/- 35%
Table 8 & 9 Footnotes
1) See account definition, in table posted this month
2) Has used at least 1 of the 7 listed online banking/payment
services during the past 6 months (+/- 15%)
3) Has accessed at least 1 of the 4 account types during the past 6
months (+/- 20%)
4) Includes any insured deposit account (does not include brokerage
cash accounts or money-market mutual funds) (+/- 20%)
5) Includes users accessing credit and charge-card accounts online
even if they don’t use an online checking account (+/- 30%)
6) Includes users of account aggregation (e.g., Yodlee, uMonitor)
at any site, bank or non-bank (+/- 40%)
7) Includes email notifications and statements (+/- 30%); excludes
marketing- or service-oriented newsletters and messaging
8) Has used any of the 3 listed epayment services during the past 6
months; does not include online purchases using a credit or debit card (+/-
25%)
9) Pays bills to multiple billers at a third-party site (not the
biller’s site); the third party can be a bank, non-bank, Quicken, or Money
(+/- 25%)
10) Pays bills directly at the biller’s Web site, or directly with the
biller in response to an email message (+/- 35%)
11) Remits/sends money to any person or business using interbank funds
transfer, does not include online POS payments using electronic funds
transfer (+/- 35%)
12) We have less information on worldwide usage, so our estimate (+/-
35%) is less precise than for the United States (+/- 15%)
13) Includes online access for any checking, credit card, or loan
account used to process business transactions (can be a personal account if
used for business purposes)
14) We use a broad definition of small businesses, including any
individual or entity producing $50,000 or more in annual revenues, includes
self-employed contractors and sole proprietors.
Table 10
What Others are Saying: Topline U.S. Online Banking Forecasts from
Major Research Companies
millions using online banking and/or bill payment each month
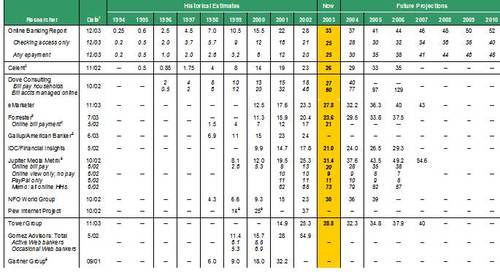
Source: Companies, 9/01 through 12/03
Notes: (1) Month/year the most recent data was collected; (2) Estimates
from 2001 and earlier were number of individual users, 2002 and beyond are
households with at least one member using online banking; the figures are
relatively comparable because up until recently very few households had more
than one person using online banking;
(3) Year 2000 estimate was made in Dec. 2000, 2001 through 2003 estimates
made in July 2003 and cited by eMarketer, 2004 to 2006 estimates made in May
2002; Forrester clients may access current forecasts at its website; (4) As
cited by the Wall Street Journal, 9/4/2002; (5) Estimates are not year-end,
the data is collected in late first or early second quarter of each year; we
assigned its market size estimates to the prior year’s year-end, e.g., we
assigned the March 2002 estimate to the year-end 2001 column; (6) Jupiter
clients can access new online banking forecasts published Dec. 2003; (8)
User base as of Sept. 2001 includes: 30.3 million tracking balances online,
17.6 million transferring funds online, 32.2 million doing at least one of
the two; in Feb. 2002, Digital Insight quoted Gartner as estimating that
18.3 million households banked online at year-end 2001

Table 11
Comparison of Online Banking Definitions: What’s Tracked
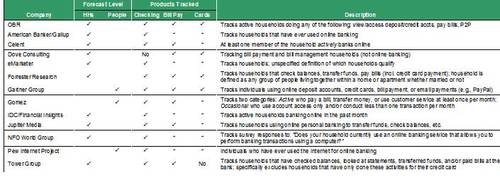
Source: Companies, 12/03 *Often left to the interpretation of
the survey respondent; who may or may not consider these activities part of
“online banking”