Looking at the entire universe (including self-employed and contractors),
for 2004 we project growth of 2 million new small business online banking
users, a slight decline from the 2.5 million who came online in 2003. And
the rate of growth, due to the higher base, will slow to 17% from
2003’s 28% (see Table 9, below).
Table 9
Forecast of U.S. Small, Microbusiness, and Self-Employed Online
Banking Usage
includes broadest definition of small business
users, population estimated at 23 million

Source: Online Banking Report projections based on industry data (+/-
30%), 3/04;
% OLB = percent of total population that is actively banking and/or paying
bills online (activity within past 6 months)
Table 10
OBR Forecast: Small Business Use of Online Banking
businesses with annual revenues from $50,000 to $10 million, not
including self-employed/contractors

Sources: 1998 to 2002 estimates, TNS Financial Services Small Business
Market Track, April ’03; (1) 1995 to 1997 and 2003 to 2013: Online
Banking Report estimates plus or minus 33%
The opportunity at your financial institution
For a rough approximation of the small business potential in
your market, use the national average business-to-consumer penetration. For
example, there are approximately 90 million U.S. households with bank
accounts. Therefore about 25% (23/90) are business owners. About 8% (7.3/90)
own businesses that are relatively easy to find via identifiable business
phone lines, D&B reports, compiled lists and so on. The difference, about 16
million, are harder-to-find self-employed and contractors.
Table 11
Estimating the Number of Microbusinesses in Your Market
Number of banking households in your market
(fill in)
Multiply by the percentage of all households that are microbusinesses
x 8% or 25%*
Approximate number of microbusinesses in your market
= _____
Source: Online Banking Report, 6/04 *Depends on whether you are looking
at all businesses including self-employed/contractors, or just the
larger small and microbusiness segment
Total market size of balance-driven banking products
Looking at just the 1.2 million larger small businesses with
revenues from $1 million to $10 million (not including
self-employed/contractors), TNS Financial estimates total business deposits
of $240 billion and the total loans and lines of $160 billion for a total of
$400 billion. In addition, we estimated the microbusiness segment ($50k to
$1 million) has another $240 billion in deposits and loans. In addition, NFO
estimates that small- and microbusiness owners have another $1.6 trillion of
deposit and loan balances in their personal accounts, for a total of $2.2
trillion. Assuming a 200 basis point (2%) spread on the balances, the sector
is generating about $44 billion in net interest revenues, an average of
$6,000 per business/owner.
But, this only accounts the money paid out to financial
services companies. It ignores the significant internal and often hidden
costs associated with financial management: accounting, bookkeeping,
payroll, treasury, and so on. With the Web, banks have an opportunity to
compete not just for the traditional financial products, but also for the
entire financial operations of the business.
Table 12
Deposit and Loan Balances and Net Interest Margin from Small-and
Microbusinesses
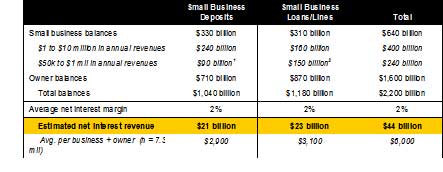
Source: Small business ($1 to $10 million) segment and owner balances
from TNS Financial Services Group 2003 Small Business Studies, 4/03;
Microbusiness balances and average net interest margin are estimates from
Online Banking Report, accuracy estimated at plus 100%, minus 50%
1OBR estimate of $15,000 per microbusiness, n =
6.0 million
2OBR estimate of $25,000 per microbusiness, n =
6.0 million
Table 13
Small Business Assets by Type, Numbers and Balances

Source: Balances from TNS Financial Services Group (formerly NFO World
Group) 2003 Small Business Studies, 4/03
Table 14
Small Business Liabilities by Type, Numbers and Balances

Source: Balances from TNS Financial Services Group (formerly NFO World
Group) 2003 Small Business Studies, 4/03
Table 15
Misc. Product Usage

Source: Balances from TNS Financial Services Group (formerly NFO World
Group) 2003 Small Business Studies, 4/03
Table 16
Financial Products Purchased for Personal Use1 by Small
Business Owners
Warning: Small sample sizes of respondents with large balances may distort
the numbers.

Source: Balances from TNS Financial Services (formerly NFO World Group/PSI
Global) 2002 SOHO and
Small Business Owner Studies, 4/02; number of small and microbusinesses from
NFO’s 2003 Small Business Study, 4/03
Total population (N) = 7.3 million U.S. small and microbusinesses, not
including self-employed/contractors, OBR estimate +/- 20%
Does not include the value of the owner’s business, commercial real estate
investments, stock options, and other misc. categories
1Products used personally, not for the business
2Total market = (% using) x (average balance) x (7.3 million micro
and small business owners)
3Total balances only, does not include auto leases or insurance
4Across all business owners, users and non-users
5Net worth = personal assets less personal liabilities, does not
include net value of business or non-residential real estate holdings
6Total personal assets less value of residential real estate, does
not include net value of business or non-residential real estate